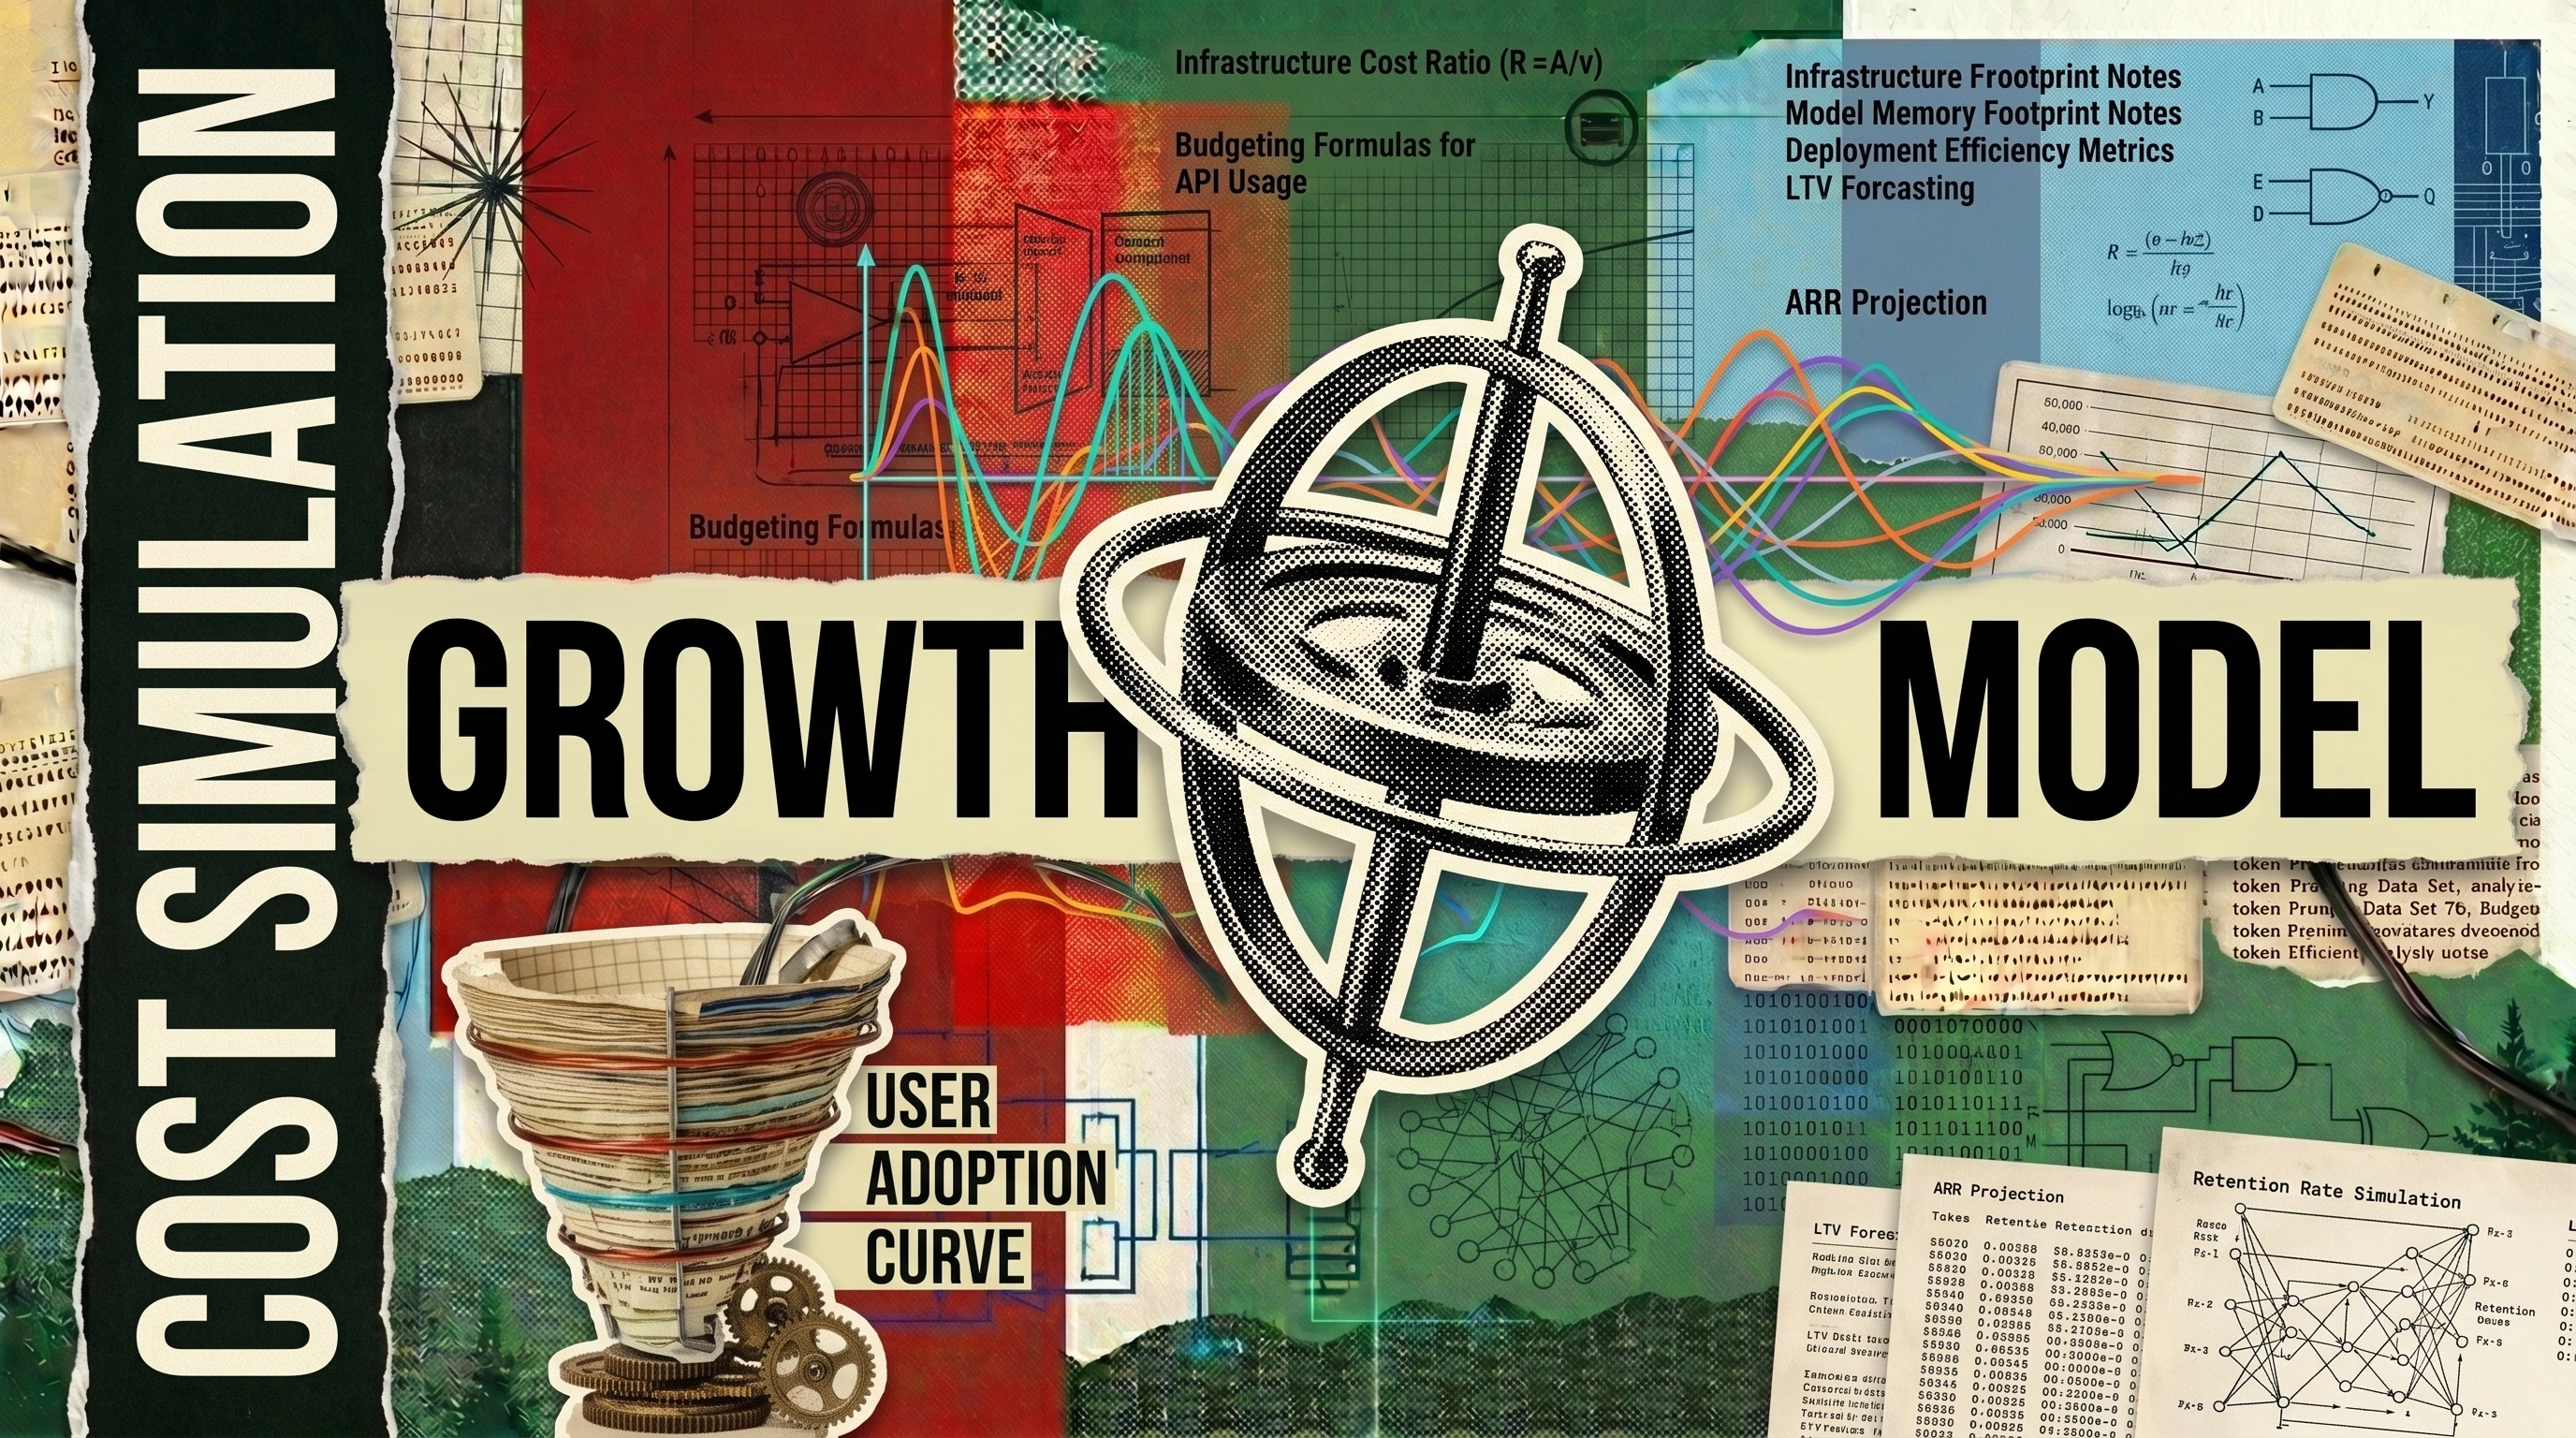
Modeling software expenditure requires looking beyond static monthly subscription costs. As enterprise software contracts transition from fixed seat pricing to consumption based and AI token usage models, financial leaders require a dedicated cost growth simulation tool framework.
What is an enterprise cost simulation tool?
An enterprise cost simulation tool is a mathematical model that forecasts software expenditure growth by combining user seat headcount growth, tier upgrade triggers, API token volume, and historical overage rates. Unlike static spreadsheets, a cost growth tool accounts for non-linear compounding cost spikes caused by automated seat additions and usage overages.
Finance teams utilizing a cost simulation tool reduce annual budget variance from an average of 34% down to under 5%. The model allows enterprise procurement managers to project 12-month software liabilities under optimistic, baseline, and stress-tested growth scenarios.
Why static SaaS budgets fail in enterprise environments
Traditional enterprise software budgeting assumes linear spending. A team calculates current monthly active users, multiplies by the list price per seat, and projects that number across four quarters. In modern enterprise environments, this methodology consistently underestimates actual spend due to four compounding variables:
- Usage-based API thresholds. Modern software platforms charge baseline subscription fees plus variable consumption rates for API transactions, storage, and compute.
- Automated tier escalation. Cloud software vendors frequently structure contracts with automatic account upgrades when usage crosses predefined monthly limits.
- Generative AI token consumption. Adding AI features to existing enterprise tools introduces variable costs tied to input and output token volume.
- Inactive license compounding. Unused software seats accumulate quietly across departments when onboarding and offboarding workflows lack automated deprovisioning.
To model these compounding factors accurately, enterprise procurement teams must implement a dynamic cost growth tool that simulates variable consumption scenarios.
Core parameters of an effective cost growth tool
A robust software cost simulation model must track five distinct variable categories across each enterprise application in the vendor portfolio:
| Parameter Category | Input Metric | Operational Impact | Simulation Formula Component |
|---|---|---|---|
| Headcount Expansion | Projected monthly hiring | Drives seat license growth | Base Seats multiplied by Monthly Growth Rate |
| Token & API Usage | Average daily transactions per user | Controls variable usage charges | Monthly Active Users multiplied by Average Tokens per User |
| Tier Upgrade Triggers | Storage or feature usage limits | Triggers step-function contract jumps | Conditional IF usage exceeds Contract Tier Limit |
| Overage Multipliers | Vendor contract terms | Penalizes unforecasted spikes | Overage Volume multiplied by Premium Unit Rate |
| Inactive Seat Retention | Offboarding latency in days | Creates passive license waste | Provisioned Seats minus Active Monthly Users |
Evaluating these variables together prevents unexpected enterprise budget overruns during periods of rapid operational scaling.
Building a 12-month software cost growth simulation model
Constructing an enterprise cost growth simulation tool requires structuring data into three distinct phases: baseline quantification, growth trajectory modeling, and risk sensitivity analysis.
Phase 1: Quantifying the operational baseline
Begin by extracting primary financial data for all enterprise software contracts exceeding 10,000 USD in annual contract value. Record the following baseline metrics:
- Total provisioned seats versus active monthly users.
- Baseline monthly recurring subscription cost.
- Contracted overage rates and included usage allowances.
- Contract renewal dates and mandatory cancellation notification windows.
Use the SaaS Seat Auditor on this site to identify active utilization rates across department accounts before establishing baseline inputs.
Phase 2: Modeling seat and consumption scaling
Apply growth projections to the baseline dataset. Seat expansion typically follows departmental hiring plans, while consumption scaling correlates with customer volume or transaction processing activity.
For generative AI applications, calculate token expenditure using average prompt length and daily user query volume:
$$\text{Monthly AI Cost} = \text{Active Users} \times \text{Daily Queries} \times 30 \times \left( \frac{\text{Input Tokens} \times \text{Input Rate} + \text{Output Tokens} \times \text{Output Rate}}{1,000,000} \right)$$
Model three distinct operational scenarios:
- Baseline Growth Scenario: Assumes projected headcount expansion and standard user query frequency.
- Aggressive Scaling Scenario: Models 150% of hiring projections combined with high AI query volume.
- Stress-Test Scenario: Simulates maxed-out API token limits, unoptimized seat provisioning, and vendor price increases.
Phase 3: Sensitivity analysis and tier threshold mapping
The final component of a cost growth simulation tool maps contract threshold jumps. Vendors often structure pricing in steps (for example, 1 to 50 users at 30 USD per month, but 51 to 100 users at 45 USD per month). Crossing a threshold by a single seat can trigger an immediate step-up in contract liability.
The table below illustrates a typical enterprise software step-function escalation cost structure:
| User Seat Bracket | Base Price Per Seat | Overage Rate Per Additional User | Automatic Contract Upgrade Trigger |
|---|---|---|---|
| Tier 1 (1 - 50 Seats) | $30 / month | $45 / month | Reaching 51 active users |
| Tier 2 (51 - 200 Seats) | $25 / month | $40 / month | Reaching 201 active users |
| Tier 3 (201 - 500 Seats) | $20 / month | $35 / month | Reaching 501 active users |
| Enterprise Custom (500+ Seats) | Negotiated rate | Fixed enterprise cap | Dedicated procurement contract review |
Identifying these contract thresholds in advance enables finance teams to negotiate enterprise caps or purchase seat bundles before automated overage penalties activate.
Strategies for controlling software cost growth
Running a cost simulation model reveals where spending accelerates fastest. Finance and procurement teams should implement three operational controls to manage software growth curves:
- Implement automated license deprovisioning. Connect Single Sign-On (SSO) activity to procurement workflows. Revoke licenses automatically when users show no activity for 30 consecutive days.
- Cap variable AI usage endpoints. Set daily token consumption caps per user or department to prevent runaway API spend from unoptimized prompts or automated batch scripts.
- Negotiate overage protection clauses. Ensure enterprise vendor agreements include notice periods and capped overage rates before usage transitions into a higher pricing tier.
Before finalizing annual technology budgets, use the AI Budget Forecast tool to calculate multi-year software expenditure projections across your operational portfolio.
Methodology and limitations
This cost simulation framework provides analytical guidelines for enterprise software evaluation. Actual software pricing structures, overage policies, and vendor terms vary. Financial managers should review primary contract documentation and consult with internal procurement specialists before making purchasing decisions.
Sources
- FinOps Foundation - Framework & Best Practices
- NIST AI Risk Management Framework
- U.S. General Services Administration - Software Management
Last reviewed: August 14, 2026 · Editorial reviewer: Rodrigo Peña Vigil